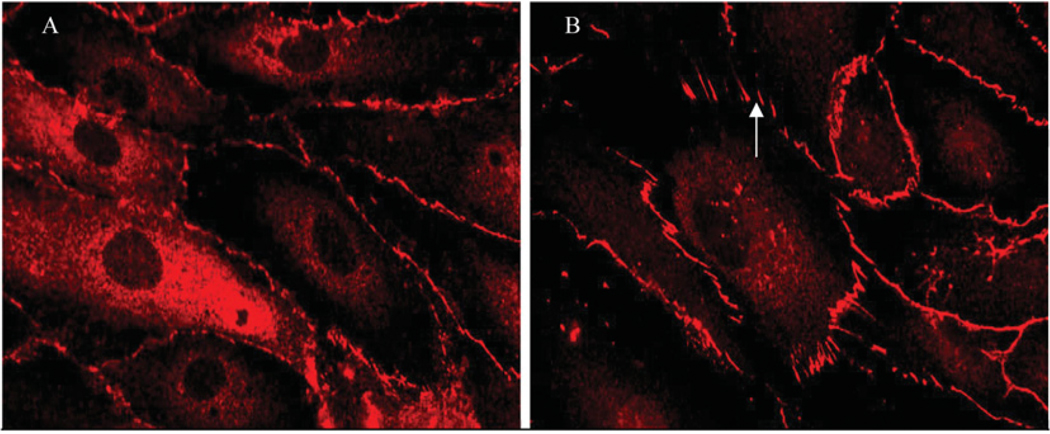
Figure 5. ZO-1 immunofluorescence before and after treatment with TGRL lipolysis products.
Images of human aortic endothelial cell monolayers showing (A) continuous ZO-1 staining with treatment with TGRL (150 mg/dl triacylglycerol), and (B) discontinuity and radial rearrangement of ZO-1 (arrow) during exposure to lipolysis products generated from co-incubation of TGRL (150 mg/dl) + LpL (2 units/ml), causing increased endothelial layer permeability. This Figure was reproduced from [166] and is used with permission. Copyright (2007) American Physiological Society.

