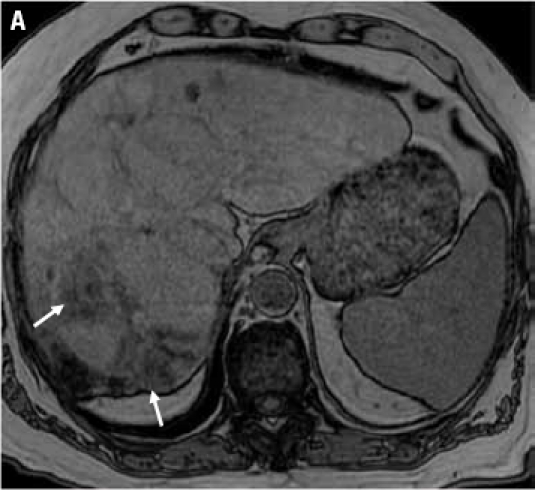
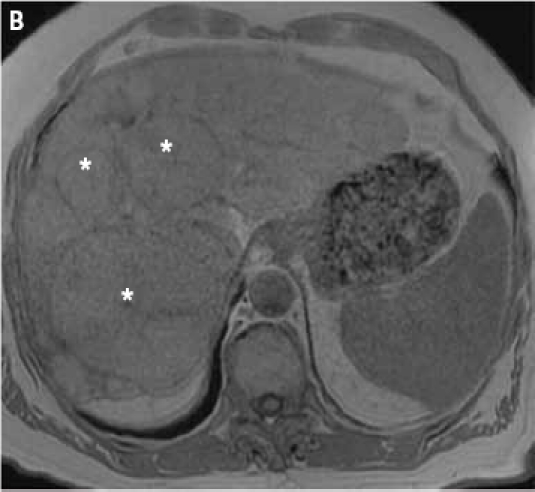
Figure 2.


2D gradient dual echo opposed-phase (A) and in-phase (B) images demonstrate multiple liver lesions (asterisks). Of note, some areas of the largest lesion (white arrows) show a loss of signal intensity on the opposed-phase image (A) indicative of fatty components.
