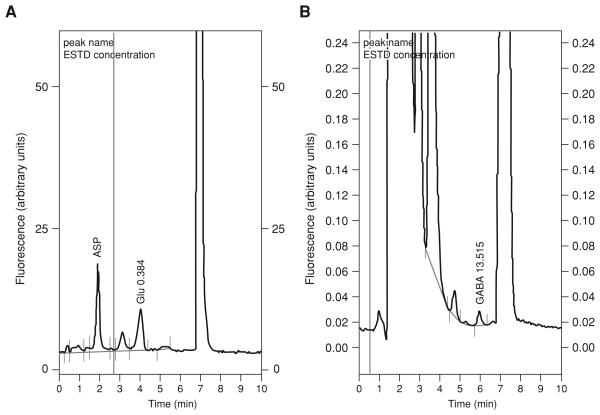
Figure 7.4.6.
Chromatograms of Glu (A) and GABA (B) in mouse nucleus accumbens dialysis samples. The system used is described in Basic Protocol 3. A 1-mm probe was used and the dialysis flow rate was 0.7 μl/min. A volume of 4 μl of dialysate was derivatized with 6 μl of OPA working solution, and 12 μl of Borax buffer were added to the final mixture. Total injection volume was 20 μl. The numbers above the Glu and the GABA peaks are the concentrations (μM and nM, respectively) in dialysate estimated from the external standard curve. The big peak eluting just before 7 min is the acetonitrile flushing injection.

