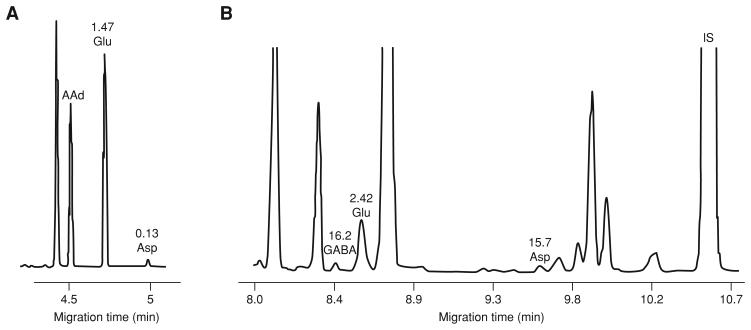
Figure 7.4.7.
(A) Electropherogram of Glu and Asp in rat striatum. A 3-mm probe was used and the dialysis rate was 1 μl/min. The sample was analyzed using the system described in Basic Protocol 4. Alpha amino adipic acid (AAd) was included as an internal standard. The numbers above the Glu and Asp peaks are the concentrations (μM) in dialysate estimated from the external standard curve. The big peak migrating just before AAd is phenylethanolamine. (B) Electropherogram of GABA, Glu, and Asp in mouse hippocampus. A 2-mm probe was used and the dialysis flow rate was 1 μl/min. Sample was collected using the system described in Alternate Protocol 3. Cysteic acid was included an internal standard (IS). The numbers above the GABA, Glu and Asp peaks are the concentrations (nM) in estimated from the external standard curve.

