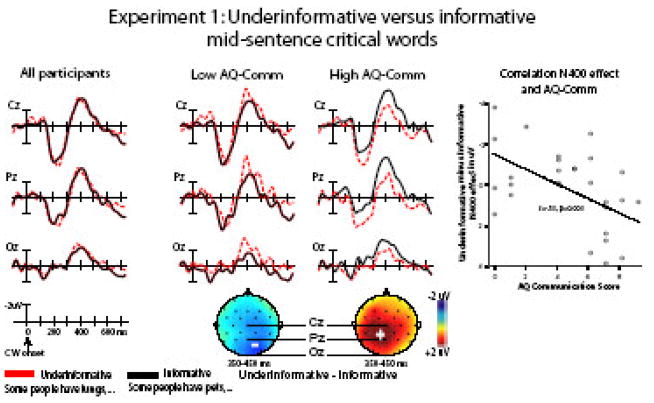
Figure 1.
Left panel: Grand-average event-related potential (ERP) waveforms elicited by critical words in underinformative (dotted lines) and informative (solid lines) statements from Experiment 1, shown at electrode locations Cz, Pz, and Oz. In this and all following figures, negativity is plotted upwards. Middle panel: Grand average ERPs elicited by critical words in underinformative and informative statements per AQ Communication group in Experiment 1, and corresponding scalp distributions of the mean difference effect (underinformative minus informative sentences) in the 350- to 450 ms analysis window. Right panel: Correlation between N400 effect and AQ Communication score.

