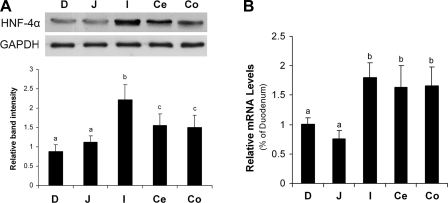
Fig. 2.
Protein and mRNA levels of HNF-4α in the gastrointestinal tract of mice. A: immunoblot analysis of HNF-4α protein levels. The immunoblot bands were quantified by densitometry analysis, and the HNF-4α-to-glyceraldehyde-3-phosphate dehydrogenase (GAPDH) ratios were calculated. B: real-time RT-PCR assay of HNF-4α mRNA levels. The gene expressions, normalized to β-actin, were expressed as relative changes, setting the values of duodenum as one. Results are means ± SD (n = 3 experiments in A, n = 4 in B). Significant differences (P < 0.05) between intestinal segments were determined by ANOVA and are indicated by different letters. D, duodenum; J, jejunum; I, ileum; Ce, cecum; Co, colon.

