Fig. 5.
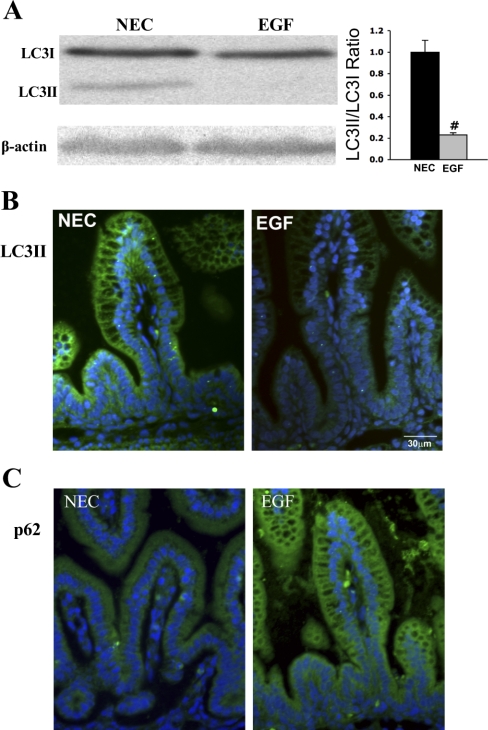
Effect of oral administration of EGF on expression and localization of LC3II and p62. A, left: representative LC3 bands from Western blot analyses are shown for the NEC and EGF groups. A lipation from LC3I (17-kDa) into the LC3II (15-kDa), an autophagosomal membrane incorporated isoform, is observed in the NEC group. Right: densitometry quantification of Western blot analysis for LC3 is presented as a ratio of LC3II/LC3I (n = 9). #P < 0.02. B: representative images from NEC and EGF groups stained for LC3II (green). Cell nuclei were stained with DAPI (blue; n = 9 animals/experimental group). C: representative images from NEC and EGF groups stained for p62 protein (green; n = 9 animals/experimental group).

