Fig. 3.
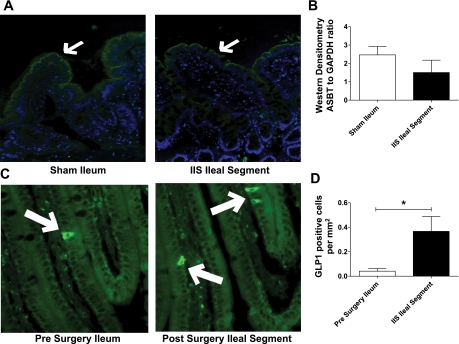
A: protein estimation for apical sodium bile acid transporter (ASBT) in ileal segment by immunohistochemistry (IHC). SH ileum and IIS ileal segment protein extracts probed for ASBT by IHC. Representative photomicrograph sections are shown with white arrows at ASBT fluorescence. B: protein estimation for ASBT in ileal segment by Western blot analysis. Quantification of Western blots was done by densitometry ratios of ASBT to GAPDH (for groups IIS and SH, n = 7 and 8, respectively). C: glucagon-like-peptide-1 (GLP-1) staining in ileum and ileal segment at study completion. Photomicrographs (×20 magnification) of histological sections stained for enteroendocrine cell marker GLP1 (positive cells stain green by fluorescent IHC). More positive stained cells can be seen in the transposed segment after surgery. D: quantification of GLP-1-positive cells per surface area. Positive cells quantified by single unbiased observer. For group IT, SH, and SH-PF, n = 6, 7, and 8, respectively (*P < 0.05).

