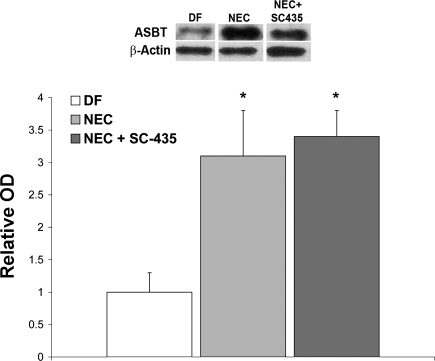
Fig. 3.
Representative Western blots and densitometry data from the rat NEC model. After normalization with β-actin, mean optical density (OD) for the dam-fed (DF) group (n = 5) was assigned a value of 1.0, and mean ODs for groups hand-fed with a cow's milk-based formula (NEC, n = 9) and NEC + SC-435 animals (n = 9) were determined relative to this number. ASBT was significantly elevated in the NEC and NEC + SC-435 groups compared with the DF group (*P ≤ 0.05 by ANOVA).

