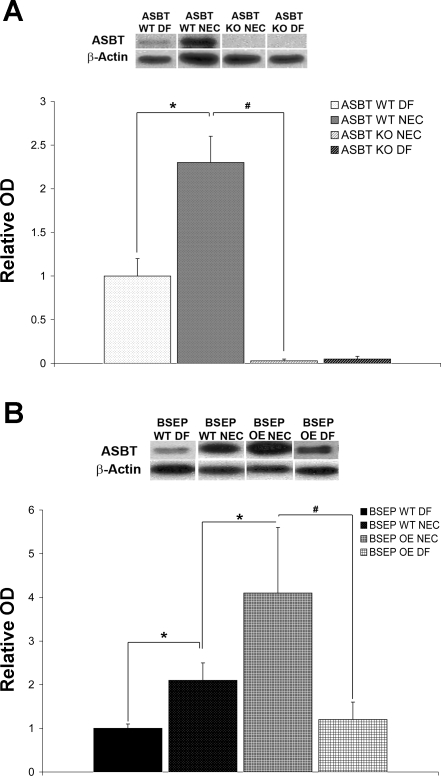
Fig. 4.
ASBT protein in neonatal mouse models of NEC. A: representative Western blots and densitometry data from ASBT WT DF (n = 5), ASBT WT NEC (n = 8), ASBT KO NEC (n = 8), and ASBT KO DF (n = 5) mice. After normalization with actin, mean OD for the ASBT WT DF group was assigned a value of 1.0, and mean ODs for all other groups were determined relative to this number. ASBT was significantly increased in the ASBT WT NEC group compared with ASBT WT DF and ASBT KO NEC groups (*P ≤ 0.05, #P ≤ 0.01). B: representative Western blots and densitometry data from BSEP WT DF (n = 5), BSEP WT NEC (n = 10), BSEP OE NEC (n = 10), and BSEP OE DF (n = 5) mice. After normalization with actin, mean OD for the BSEP WT DF group was assigned a value of 1.0, and mean ODs for all other groups were determined relative to this number. ASBT was significantly increased in BSEP WT NEC compared with BSEP WT DF animals (*P ≤ 0.05), BSEP OE NEC compared with BSEP WT NEC animals (*P ≤ 0.05), and BSEP OE NEC compared with BSEP OE DF animals (#P ≤ 0.01). Densitometry data are expressed as means ± SD. Statistical analyses were performed using ANOVA.

