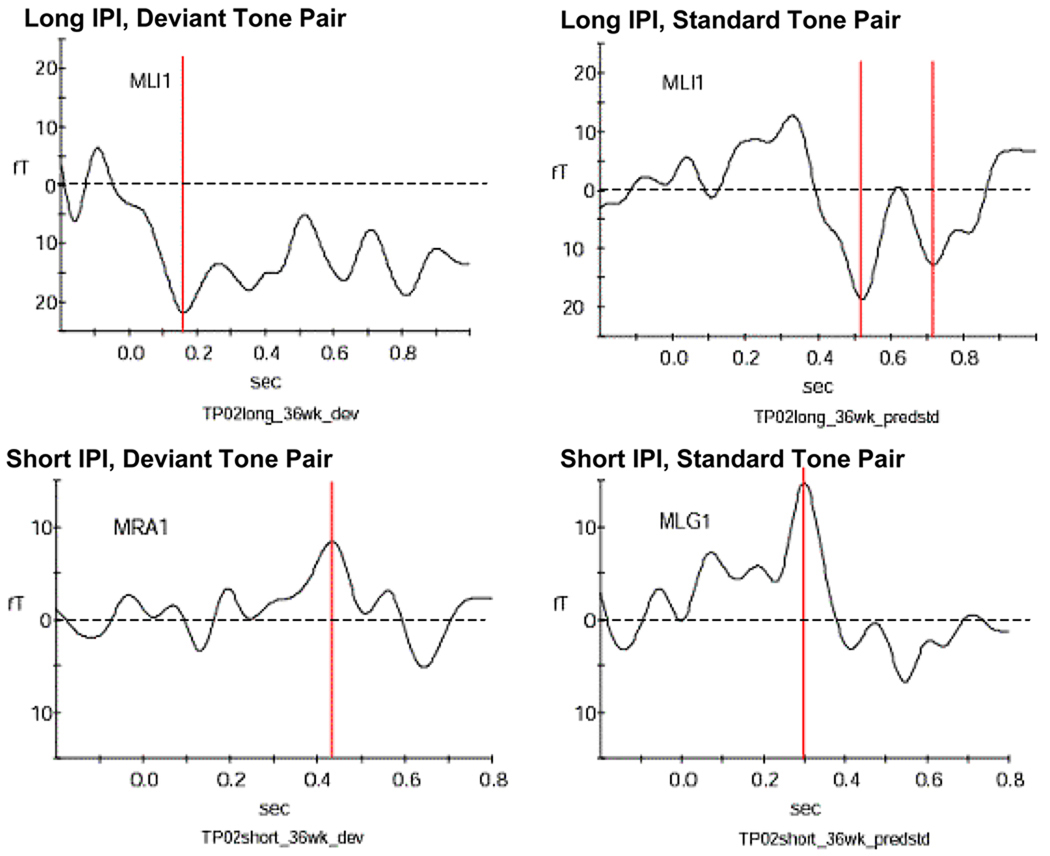
Figure 4. Example for responses from a fetus at 36 weeks GA.
This neonate responded with one peak to the long deviant tone pair, with two peaks to the long standard tone pair and with one peak to both short IPI conditions. The peaks are indicated by the red bar. The dotted line marks the zero level of the amplitude.
MLI1, MRA1 and MLG1 indicate which one of the 151 sensor arrays recorded the signal shown above.

