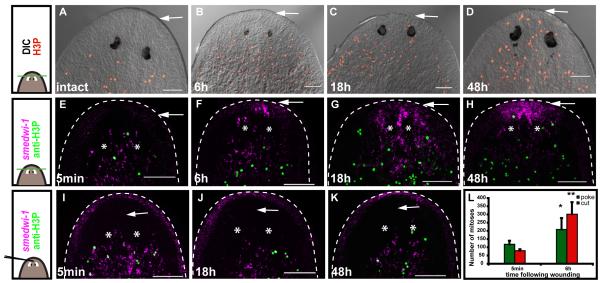
Fig. 5. Loss of tissue induces neoblast recruitment to wounds.
(A-K) Cartoons at left depict surgery types. Top and middle, amputation of the head tip (green line); bottom, black line indicates site of needle poke. White arrows on images indicate the sites of amputation or needle poke in head tips. White asterisks indicate photoreceptors. Anterior, up. Bars, 100μm. (A-D) Mitotic cells appear in front of the photoreceptors at (C) 18h and (D) 48h after amputation. Differential interference contrast (DIC) image superimposed with image of mitotic cells (anti-H3P, red). (E-K) smedwi-1+ cells (magenta – fluorescence at animal periphery is non-specific) and mitoses (green) accumulate in head tips (a region normally devoid of neoblasts) at 18h and 48h, respectively, when the head tip was amputated (E-H), but not following a needle-poke (I-K). (L) A head tip needle-poke induces a first mitotic peak. Data represent averages (n ≥ 3) ± sd. Mitoses were quantified from z-stacks through the entirety of the DV axis from tip of the head to the posterior base of the pharynx. Data were significantly higher at 6h than at 5min; **p<0.01 and *p<0.05 by Student’s t-test.

