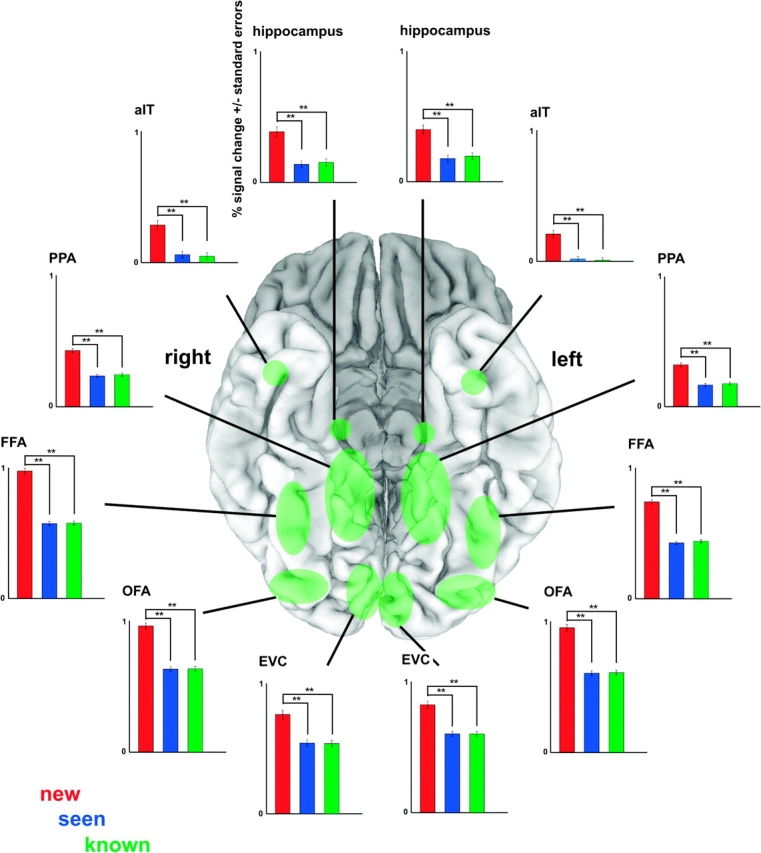
Figure 6.

ROI analysis for face-familiarity effects. All ROIs showed more activation to new than seen and known faces. Seen and known faces elicited equal activation. Approximate ROI locations are shown (in green) on a ventral view of the cortex (shown here: MNI template colin27). Graphs show percent signal change and associated standard errors for the new (red), seen (blue), and known (green) predictors, averaged across subjects. All possible contrasts (new vs. seen, new vs. known, and seen vs. known) were tested for significance. Significant contrasts are shown and denoted with **(P < 0.01). ROIs were defined using independent data. See Table 1 for abbreviations and ROI details (including ROI-defining contrasts).
