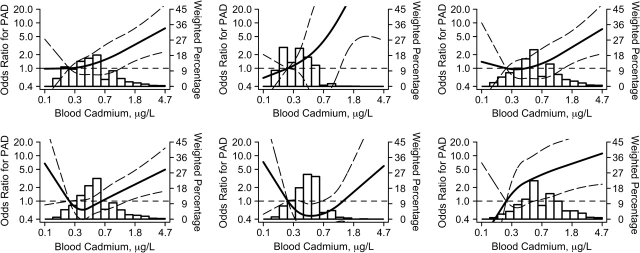
Figure 1.
Odds ratios for peripheral arterial disease (PAD) by blood cadmium levels, National Health and Nutrition Examination Survey, 1999–2004. Shown are adjusted odds ratios (solid lines) and 95% confidence intervals (curved dashed lines) based on restricted quadratic splines for log-transformed cadmium concentrations with knots at the 10th, 50th, and 90th percentiles. The reference value was set at the 10th percentile of cadmium distribution. Vertical bars represent the weighted histogram of cadmium distribution. Odds ratios for PAD were adjusted for survey year, age (years modeled as restricted cubic spline with 5 knots), sex, race/ethnicity, body mass index (kg/m2), low educational level (<high school, ≥high school), smoking status (never, former, current), serum cotinine (log ng/mL), diabetes mellitus (yes, no), menopause status (yes, no), systolic blood pressure (mm Hg), antihypertensive medication (yes, no), C-reactive protein (log mg/L), total cholesterol (mg/dL), high density lipoprotein cholesterol (mg/dL), cholesterol-lowering medication (yes, no), estimated glomerular filtration rate (mL/minute per 1.73 m2), and blood lead (log μg/dL). Men- and women-stratified analyses are shown in the top and bottom rows, respectively. Overall (both never and ever smokers together; left column) and analyses stratified by never smoker and ever smoker status (middle and right columns, respectively) are shown.

