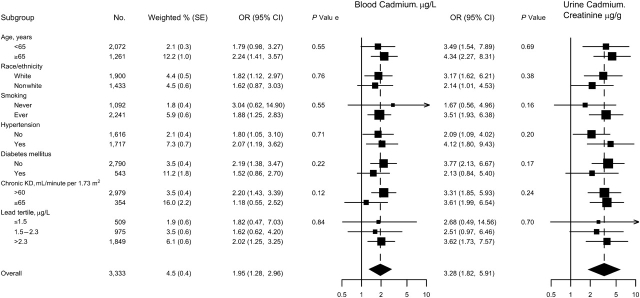
Figure 2.
Odds ratios (ORs) for peripheral arterial disease comparing the 80th with the 20th percentile of blood or urine cadmium distribution in men (N = 3,333), by participant characteristics, National Health and Nutrition Examination Survey, 1999–2004. The 80th and 20th percentiles of cadmium distributions were 0.80 and 0.26 μg/L, respectively, for blood cadmium and were 0.69 and 0.20 μg/g creatinine, respectively, for creatinine-corrected urine cadmium. Odds ratios and 95% confidence intervals (CIs) comparing the 80th with the 20th percentiles of the blood or urine cadmium distribution were calculated by assuming a log-linear relation. Odds ratios were adjusted for survey year, age (years modeled as restricted cubic splines with 5 knots), sex, race/ethnicity, body mass index (kg/m2), low educational level (<high school, ≥high school), smoking status (never, former, current), serum cotinine (log ng/mL), diabetes mellitus (yes, no), systolic blood pressure (mm Hg), antihypertensive medication (yes, no), C-reactive protein (log mg/L), total cholesterol (mg/dL), high density lipoprotein cholesterol (mg/dL), cholesterol-lowering medication (yes, no), estimated glomerular filtration rate (mL/minute per 1.73 m2), and blood lead (log μg/dL). Estimated 2-sided P values for interaction between log-linear cadmium with participant characteristics were computed by using the Wald test adjusting for complex design. KD, kidney disease; SE, standard error.

