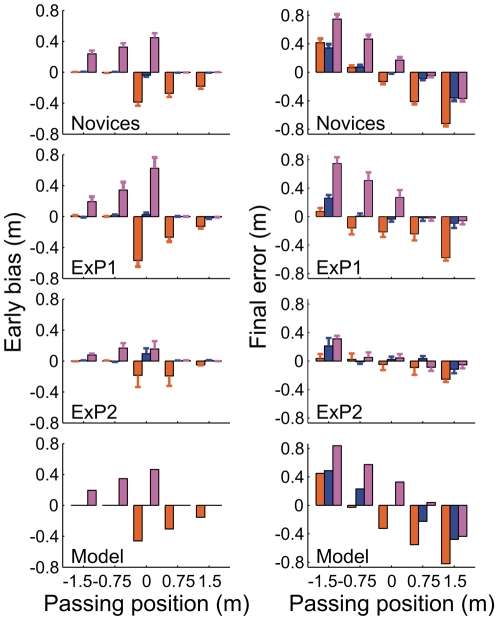
Figure 4. Movement biases in goalkeeping.
Left and right panels show the early bias and final error, respectively, broken down as a function of the passing position and curve direction (orange = counter-clockwise spin [CCS]; blue = no spin [NS]; pink = clockwise spin [CS]). Top panels show the averaged data for the novices; values are averaged over 10 trials (five repetitions for two initial ball positions) and 10 participants. Error bars show standard errors across participants. The second and third rows depict the averages for ExP1 and ExP2, respectively, where error bars indicate standard errors across the 10 trials. The bottom row indicates the values calculated from the model simulations (see Figure 2).

