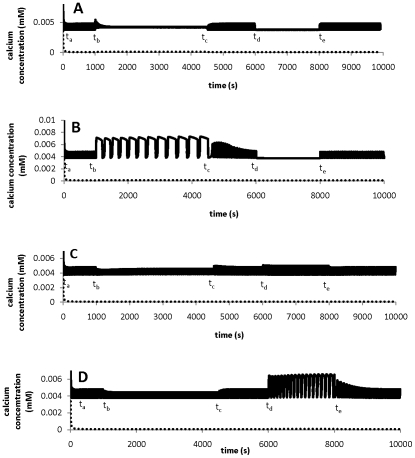
Figure 5. Response of calcium concentration to changes in external ion concentrations.
The tip : solid line; the shank: dashed line. These responses qualitatively agree well with experimental observations [26]. A: changes in external calcium concentration: ta: [Ca]e = 1mM; tb: [Ca]e = 5 mM; tc: [Ca]e = 1 mM; td: [Ca]e = 0.05 mM; te: [Ca]e = 1 mM. B: changes in external pH: ta: pHe = 5.5; tb: pHe = 6.5; tc: pHe = 5.5; td: pHe = 4.5; te: pHe = 5.5. C: changes in external potassium concentration: ta: [K]e = 1mM; tb: [K]e = 3 mM; tc: [K]e = 1 mM; td: [K]e = 0.03 mM; te: [K]e = 1 mM. D: changes in external chloride concentration: ta: [Cl]e = 1mM; tb: [Cl]e = 1.5 mM; tc: [Cl]e = 1 mM; td: [Cl]e = 0.015 mM; te: [K]e = 1 mM.

