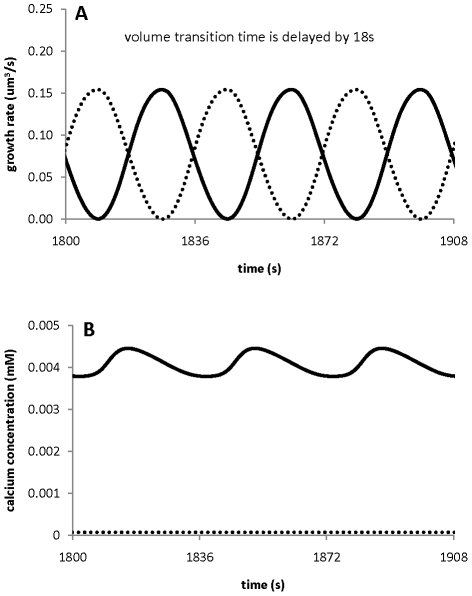
Figure 8. Oscillations induced by the volume transition.
Oscillations at the tip can be induced by the transition of the tip volume to the shank volume. A. transition of tip volume to shank volume is delayed by 18s when [Y] periodically changes following equation (5) with  mM,
mM, 
 s. B. Growth-induced oscillations in calcium concentration at the tip.
  s−1 for chloride channel at the tip and all other parameters are the same as in Tables 1 and 2. Tip: Solid line; shank: dashed line.

