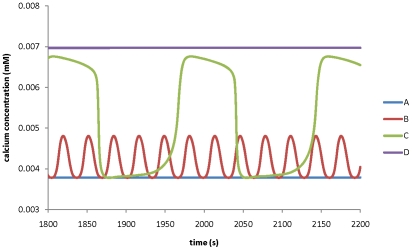
Figure 10. Modelling prediction for the effects of the maximum conductance of H+ ATPase pump on calcium ion dynamics at the tip.
The maximum conductance of H+ ATPase pump at the tip is A) 0.8 S m−2 ; B) 0.95 S m−2; C) 1.5 S m−2; D) 2.5 S m−2 respectively. All other parameters are the same as in Tables 1 and 2.

