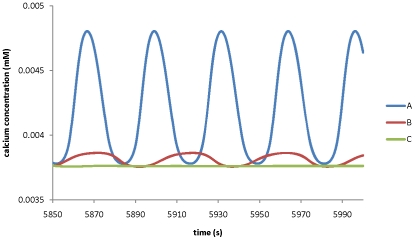
Figure 11. Effects of growth rate on the dynamics of calcium concentration.
The tip volume increases following growth rate. The surface that is occupied by transporters to the volume ratio decreases following  µm−1. All other parameters are the same as in Tables 1 and 2. Growth rate is A) 0 µm3s−1; B) 25 µm3s−1; C) 50 µm3s−1.

