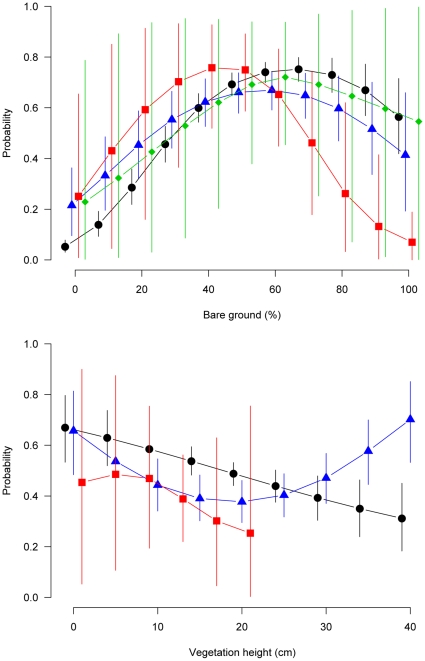
Figure 1. Marginal selection probability of foraging locations in relation to amount of bare ground and vegetation height for four farmland bird species.
Predictions are revealed from the best models (see the supporting information) and refer to hoopoes (black dots), wrynecks (blue triangles), woodlarks (red squares) and common redstarts (green diamonds). Note that selection probabilities below 0.5 indicate avoidance, selection probabilities above 0.5 indicate preference. Points are posterior means, vertical lines show the limits of the 80% credible intervals.

