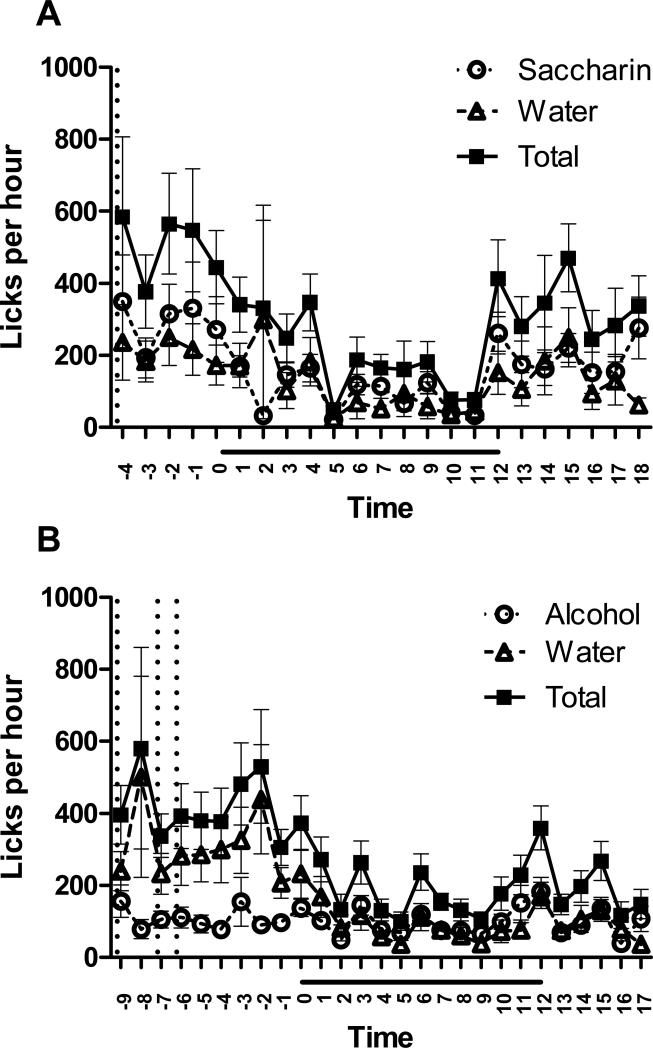
Figure 4. Fluid intake and the circadian cycle.
A) Average intake of saccharin, water, and total fluid, collapsed across days 3-4 of testing with saccharin. B) Average intake of ethanol, water, and total fluid, collapsed across days 1-4 of testing with ethanol. Values represent number of licks per hour for all animals, indicating mean ± SEM; n = 24. X-axis values represent number of hours from ‘lights off’ time. Horizontal black bars indicate the dark phase of the circadian cycle. Vertical dotted lines indicate the time at which fluids were replaced between successive test days.

