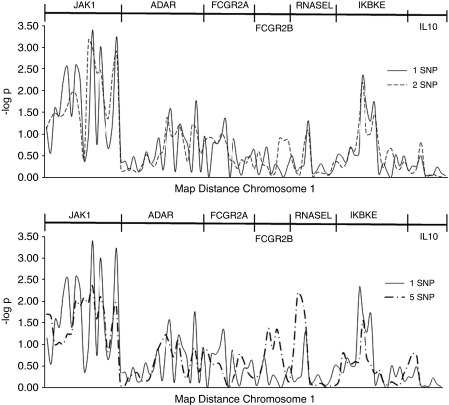
Figure 3.
Sliding window haplotype analysis on chromosome 1. SNPs were sequentially grouped in windows of 2, 3, 4, and 5 and tested for association with DHF. The results for 1, 2, and 5 SNP windows are shown. The y axis shows P-values transformed to –log10 p. The x axis provides the relative map order and distance along chromosome 1 for each marker. The order of each candidate gene is shown at the top of the graph.

