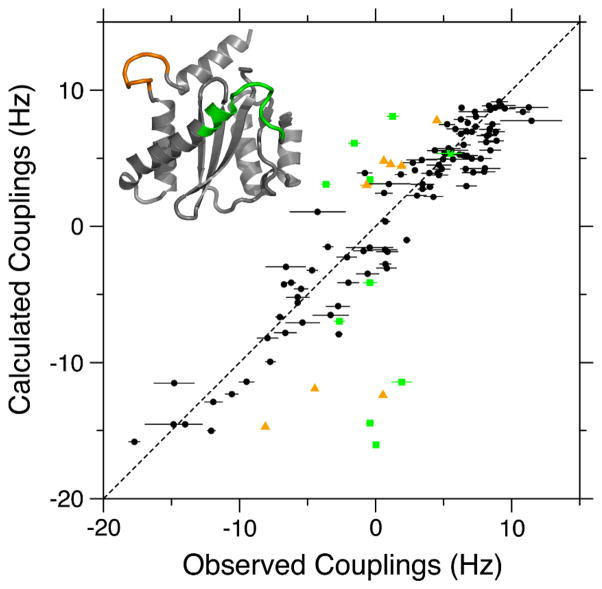
Figure 3.
Best fit correlation between ARTSY-derived 1DNH RDCs for homodimeric IN50-192 and the coordinates of PDB entry 1BIS, chain B (Goldgur et al. 1998). The alignment tensor was best-fitted using the DC program in the NMRPipe software package (Delaglio et al. 1995). Black symbols correspond to the 97 RDCs used in fitting (Q = 0.279). Green squares and orange triangles correspond to the active site loop (residues 140–152) and the loop between helices α5 and α6 (residues 187–194) (see colored regions on the inset structure) and were not included in the RDC fit. These amides were shown to be dynamic in 15N relaxation measurements (Fitzkee et al. 2010). Slightly better fits are obtained using the chains of PDB entry 1BIU (Q ~ 0.26), but its chains lack density for residues 141–148 of the catalytic loop (Goldgur et al. 1998).

