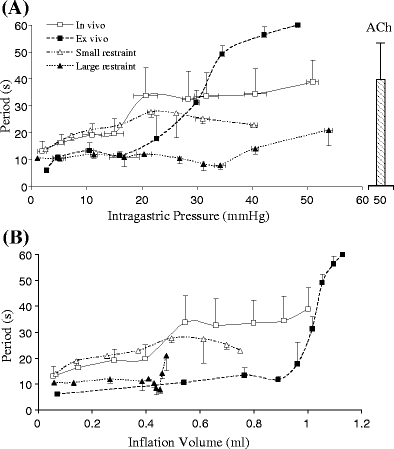
Fig. 6.

The period of gastric contractility. a The period was represented as a function of intragastric pressure. b The period was represented as the function of inflation volume. The legends were defined the same as Fig. 4. The statistical analysis (ANOVA) is as follows: P < 0.05 between ex vivo and in vivo; P < 0.05 between in vivo and large restraint; P > 0.05 between in vivo and small restraint. The data for ex vivo small and large restraints were not shown since the contraction was inhibited
