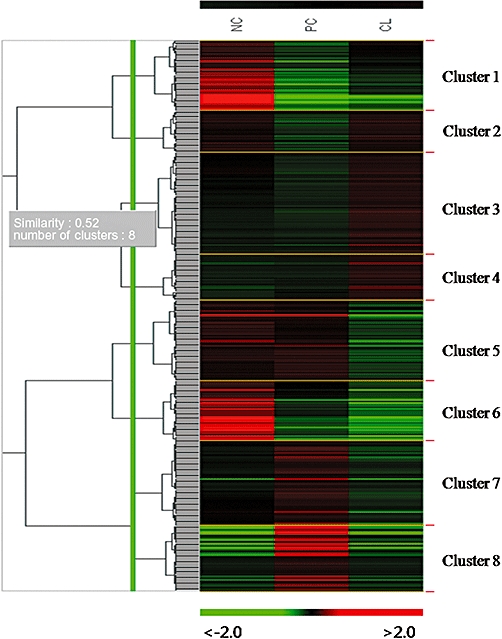
Figure 3.

Overview of all gene expression profiles. Microarray data from control (non-treated HEK 293 cells) and experimental (cisplatin or cisplatin plus CL-treated HEK 293 cells) groups were combined and clustered. Each gene is represented by a single row of clustered boxes and each column represents the average expression levels of all genes in three independent hybridization samples. Experimental conditions (NC non-treated control, PC cisplatin-treated control, and CL cisplatin plus CL-treated) are shown at the top of the data matrix. A colour bar indicates higher levels of gene expression in the sample in red and lower levels in green when compared with those in the common reference RNA
