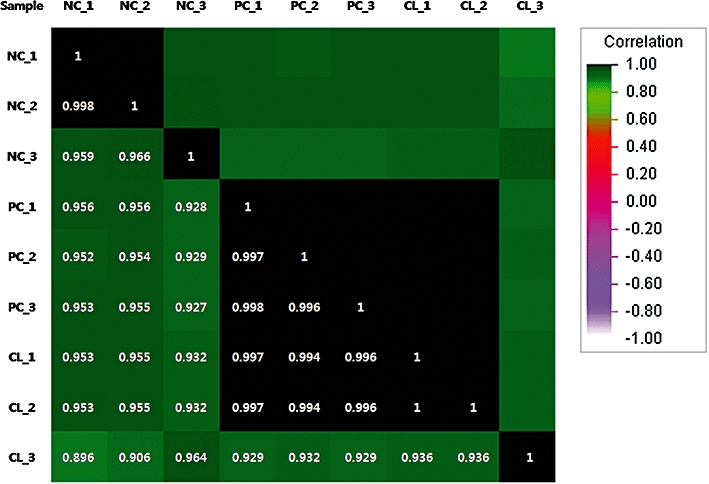
Figure 4.

Correlation matrix plot analysis for calculation of the reproducibility between triplicates. The r2 value is based on the intensity of signals from all probe sets on the Affymetrix Human Genome U133 Plus 2.0 GeneChip array. Based on the r2 value, the microarray hybridization patterns were highly consistent among samples. NC non-treated control, PC cisplatin-treated control, CL cisplatin plus CL-treated
