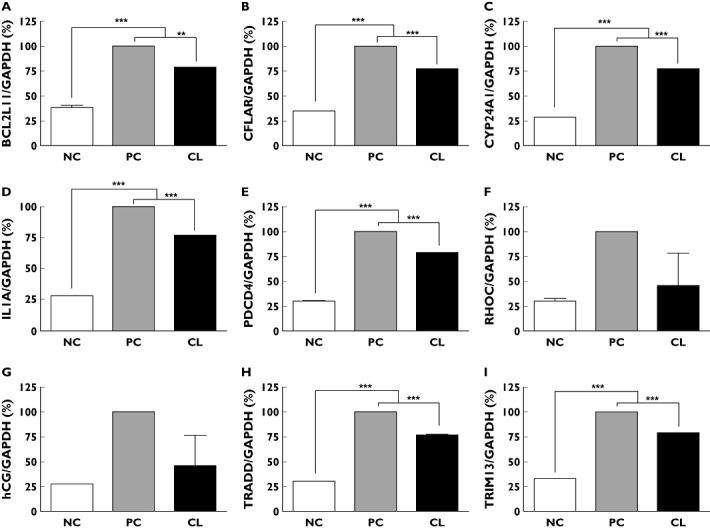
Figure 5.

Effects of CL extract on mRNA concentrations as determined by real-time RT-PCR. (A) BCL2L11, (B) CFLAR, (C) CYP24A1, (D) IL1A, (E) PDCD4, (F) RHOC, (G) hCG, (H) TRADD, and (I) TRIM13. NC non-treated control, PC cisplatin-treated control, CL cisplatin plus CL-treated. Data are presented as the mean ± SEM (n = 3). **P < 0.01 and ***P < 0.001 when compared with control
