
Figure 3.
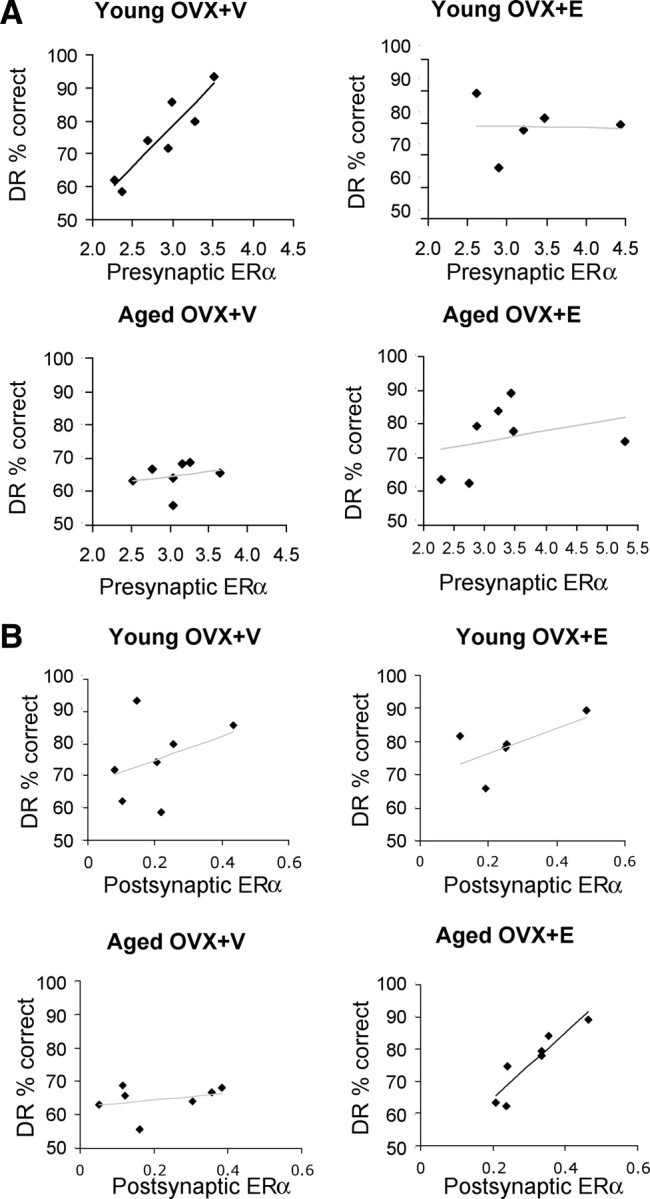
Quantitative analysis of ER-α labeling in presynaptic and postsynaptic domains and correlation with performance on DR. A, Regression analyses correlating the average number of gold particles in presynaptic terminals with DR performance in each group. Note the strong correlation between abundance of presynaptic gold particles and DR performance in young OVX+V (Pearson correlation, r = 0.912, p = 0.004). No significant correlation exists in the other three groups (p > 0.5). B, Regression analyses correlating the average number of gold particles in the postsynaptic domain 30–60 nm from the synaptic membrane with DR performance in each group. Note the strong correlation between performance on DR and gold particles in the 30–60 nm bin for the aged OVX+E group (Pearson correlation, r = 0.912, p = 0.004) and the lack of such a correlation in the other three groups. No other postsynaptic bin displayed a correlation with DR performance.