
FIGURE 2.
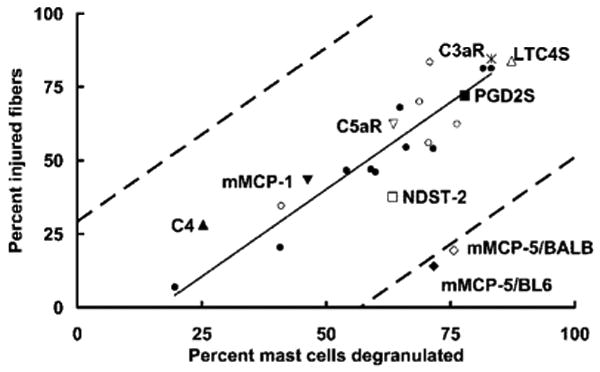
Correlation of IR-induced muscle damage with MC degranulation. The mean percentage of injured muscle fibers vs the mean percentage of degranulated MCs after hind limb IR injury was plotted for each mouse strain studied in this investigation. The correlation coefficient and solid trend line are based on the mean values from the injured wild-type control groups (C57BL/6 (●), n = 10, and BALB/c (○), n = 5) in the individual experiments including the time course presented in Fig. 1. The Pearson correlation coefficient (R2) for the data for wild-type mice alone is 0.85. The 95% confidence interval relative to the trend line is indicated by dashed lines. Also indicated are the mean percentages for muscle injury and MC degranulation obtained from all studies with transgenic mice that do not express C3aR (*), C5aR (∇), C4 (▲), LTC4S (△), PGD2S (■), mMCP-1 (▼), mMCP-5/BL6 (◆), mMCP-5/BALB (◇), or NDST-2 (□).