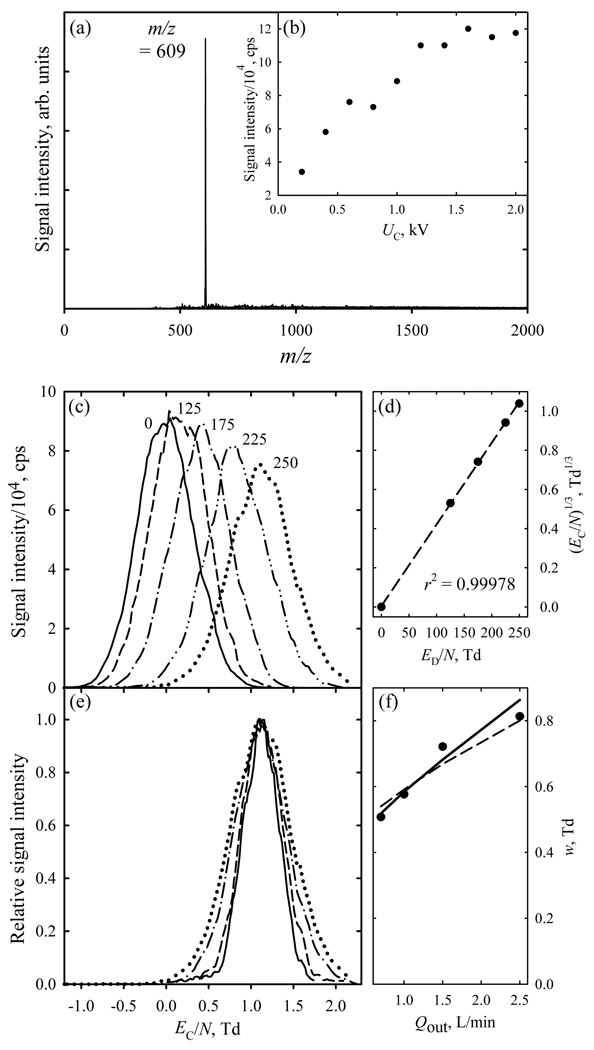
Fig. 2.
FAIMS/MS data for reserpine: (a) total MS spectrum; (b) base peak intensity depending on the curtain plate voltage; (c) FAIMS spectra (Qout = 2.5 L/min) for m/z = 609 at ED/N values (in Td) as labeled; (d) cubic root of EC/N values in panel (c) versus ED/N (circles) and linear regression through the dependence (line); (e) normalized FAIMS spectra for m/z = 609 at ED/N = 250 Td with Qout of 2.5 (dotted line), 1.5 (dash-dot), 1.0 (dashed), and 0.7 L/min (solid); (f) measured (circles) and calculated (lines) peak widths for the conditions in (e), with solid and dashed lines representing the simulations and the square root scaling with the separation time, respectively.

