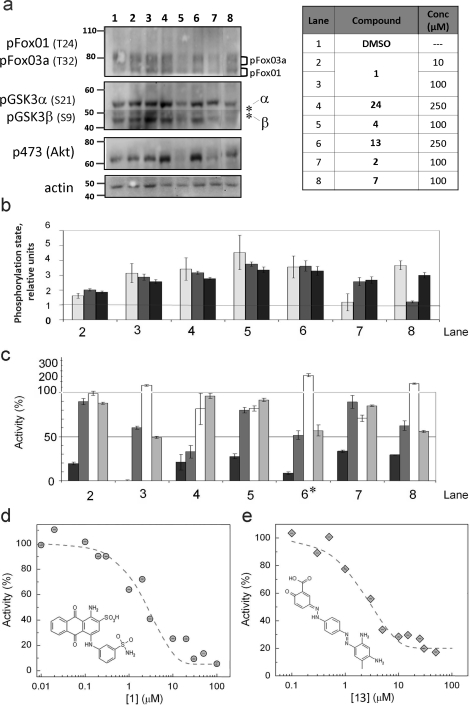
Figure 6.
Cellular potency and specificity of PHLPP inhibitors. (a,b) Effect of different inhibitors on Akt phosphorylation. HT29 cells in DMEM supplemented with 5% FBS were treated for 24 h with different compounds (see table). Blots were probed with antibodies specific to phospho-Akt (S473), phospho-GSK3α/β (S21/9), phospho-FoxO1/3a (T24/32), and actin. (b) Densitometric analysis was performed on blots from three separate experiments. The levels of phosphoproteins are normalized to actin. The phosphorylation of Akt at Ser 473 (white bars), FoxO 1/3 (light-gray bars), and GSK 3α/β (dark-gray bars) is calculated relative to control lanes. The graph represents mean values ± SEM from three separate experiments. (c) Selectivity toward other phosphatases. pNPP (8 mM) was incubated in 125 μL of the optimal assay buffer for each protein, in the presence of the PP2C domain of PHLPP2 (black bars), PP1 (dark-gray bars), PP2B (white bars), or PP2Cα (light-ray bars). Compounds (see table) were added. The activity of the enzyme is relative to the DMSO control. The graph represents mean values ± SEM of at least three different experiments. * denotes that compound 13 was tested at 100 and not 250 μM (d,e) in vitro inhibition curves for compound 1 (d) and 13 (e). The inhibitor, diluted in DMSO, was incubated in assay buffer with 8 mM pNPP in the presence of 1 μM enzyme. Activity was calculated relative to DMSO alone. The mean activity ± SEM for five different experiments are represented (gray solid circle, 1; gray tilted solid squares, 13) and were fit with eq 1.

