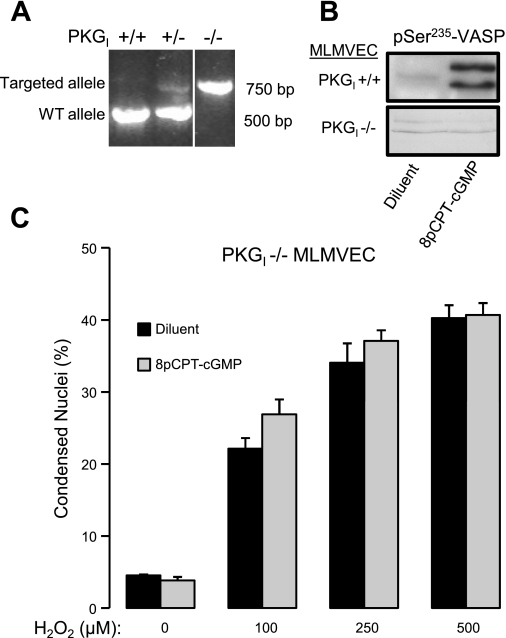
Fig. 2.
A: ethidium bromide staining of PCR fragments used to identify PKGI−/− mice. The order of lanes from the same gel has been rearranged (indicated by the white line between lanes). B: Western blot of vasodilator-stimulated phosphoprotein (VASP) phosphorylated on Ser235 in PKGI+/+ and PKGI−/− exposed to diluent or 8pCPT-cGMP (50 μM). C: effect of 8pCPT-cGMP (50 μM) on the dose-response relationship between increasing concentrations of H2O2 and the percentage of condensed MLMVEC nuclei (n = 4). Values are means ± SE. P = not significant.

