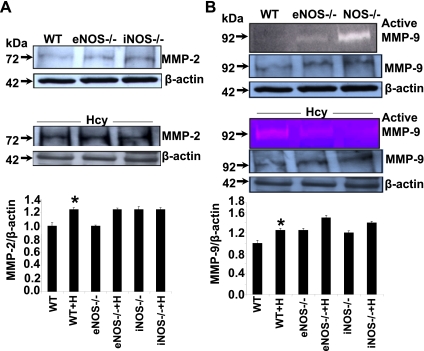
Fig. 5.
Effect of Hcy on matrix metalloproteinases MMP-2 and -9. A: Western blot analysis of tissue lysates from aorta of mice in control and Hcy-treated WT, eNOS−/−, and iNOS−/−. Bands indicate MMP-2 and β-actin to verify equal loading of protein. Bar graph for MMP-2 expression quantified by densitometry and expressed fold change from WT control and fold change from WT+H. Bars are means ± SE (n = 3). B: active MMP-9 was detected by zymography as white bands indicate sites of gelatin digestion for 92-kDa pro-MMP-9. Western blot analysis of tissue lysates from aorta of mice in control and Hcy-treated WT, eNOS−/−, and iNOS−/−. A and B: bands indicate MMP-9 and β-actin to verify equal loading of protein. MMP-9 expression was quantified by densitometry and expressed fold change from WT control and fold change from WT+H. Bars are means ± SE (n = 3). *Significant (P < 0.05) increase compared with WT. Although we used control samples on 1 set and treated samples on a different set, the actin blots show similar loading in respective gels.

