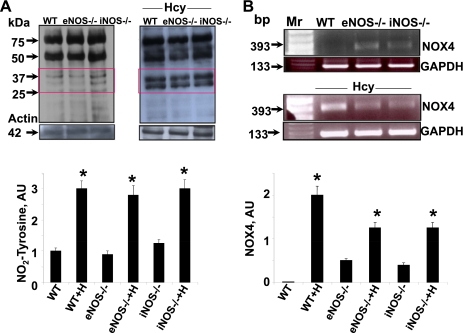
Fig. 8.
Oxidative stress. A: Hcy-mediated nitrotyrosine generation. Western blot analysis of nitrotyrosine formation as an index of reactive nitrogen species (RNS) in tissue lysates from NOS gene knockout mice with and without Hcy treatment. Bars graphs are nitrosylated proteins at 37 and 25 kDa quantified by densitometry and expressed fold change from WT control and fold change from WT+H. Bars are means ± SE (n = 3). Note the increases in readily visible nitrotyrosine adducts identified by several unidentified bands of 25- to 75-kDa molecular mass. B: effect of Hcy on NADPH oxidase subunit NOX4 mRNA. RT-PCR analysis of tissue mRNA from aorta of mice in WT control, eNOS−/−, and iNOS−/− with and without Hcy. Representative agarose (1%) gel analysis of PCR products of NOX4. Bands indicate NOX4 and GAPDH (a housekeeping gene), which was used as an internal standard to verify equal loading of PCR products. Mr lane with DNA molecular mass marker. NOX4 expression was quantified by densitometry and expressed fold change from WT control and fold change from WT+H. Bars are means ± SE (n = 3). *P < 0.05 compared with WT.

