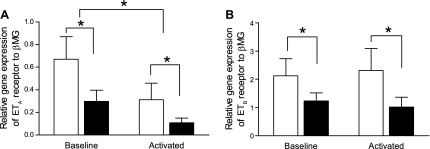
Fig. 2.
A and B: quantitative real-time RT-PCR analysis of ETA and ETB receptor gene expression in BMDM from control (open bars) and BMPR2 mutant mice (solid bars). At baseline, ETA and ETB receptor expression was lower in mutant BMDM compared with control cells. In activated BMDM from control and BMPR2 mutant mice, ETA receptor expression was significantly decreased, whereas ETB receptor expression remained unchanged. On activation with LPS, ETA receptor expression was further decreased in BMPR2 mutant BMDM compared with controls. Data are expressed as means ± SE of copy numbers per 200 ng of sample RNA normalized to β-microglobulin (βMG) (n = 6); *P < 0.05.

