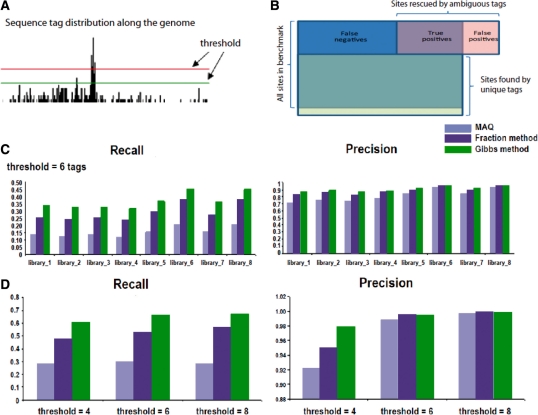
Fig. 3.
Compariion of algorithm performance. (A) Illustration of data used to test algorithm performance. (B) Variant tag count thresholds could used in the algorithm tests. (C) Recall and precision fractions for map sites are shown for the algorithms compared here (MAQ, blue; fraction method, dark blue; Gibbs sampling method, green) over eight tag libraries. (D) Recall and precision are shown for the larger tag library across three tag thresholds.

