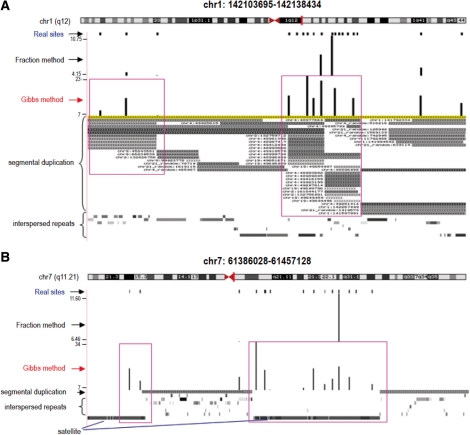
Fig. 4.
Examples of ambiguous tag mapping results. Tracks are shown through UCSC Genome Browser. The track of real sites shows the sites in the benchmark libraries. The track of Fraction method shows the mapping result by fraction method and the track of Gibbs method shows the mapping result by our Gibbs method. The heights of data represent the number of tags mapped to those sites. The tracks of repetitive genomic regions (segmental duplications, interspersed repeats and simple repeats) are also shown.

