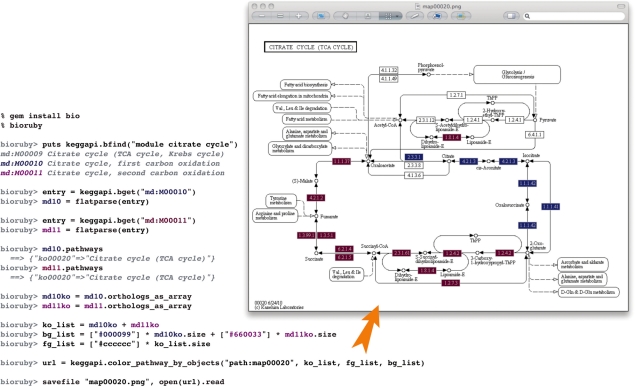
Fig. 1.
BioRuby shell example of fetching a KEGG graph using BioRuby's KEGG API (Kanehisa et al., 2008). After installing BioRuby, the ‘bioruby’ command starts the interactive shell. With the bfind command, the KEGG MODULE database is queried for entries involved in the metabolic ‘cytrate cycle’ or tricarboxylic acid cycle. The purple and blue colours, in input and output, reflect two modules in the carbon oxidation pathway. The user loads and confirms entries by using flatparse and pathways commands. Next, KEGG ORTHOLOGY database IDs are fetched and the colours are assigned to enzymes in each module. Finally, KEGG generates the coloured image of the ‘cytrate cycle’ pathway and the image is saved locally.

