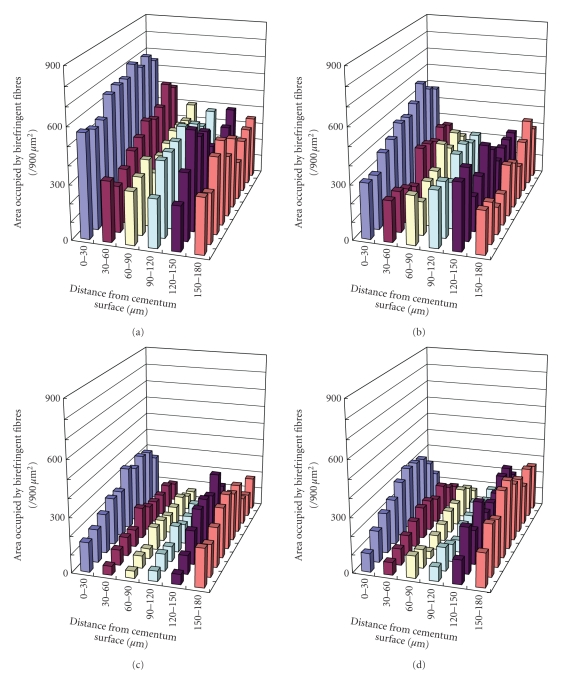
Figure 5.
Changes in the collagen fibres of PDL specimens after collagenase treatment, as represented by the area occupied by birefringent fibres in each grid (Figure 4). Data were analysed for specimens treated with PBS (a), 8 units/mL collagenase (b), 16 units/mL collagenase (c), or 24 units/mL collagenase (d). Each column represents the mean of six specimens.

