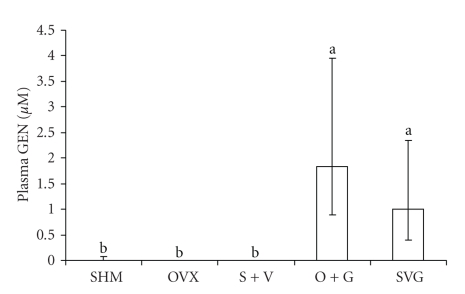
Figure 4.
A comparison of plasma GEN concentrations as a result of dietary treatments in mice. Data represent the group median and error bars indicate the interquartile range for samples collected after 18-wk GEN or no-GEN in the base diet. The Kruskal-Wallis test for nonparametric data revealed a significant difference between groups (P < .0001), and values with a different letter are statistically different based on Dunn's post hoc multiple comparison procedure.

