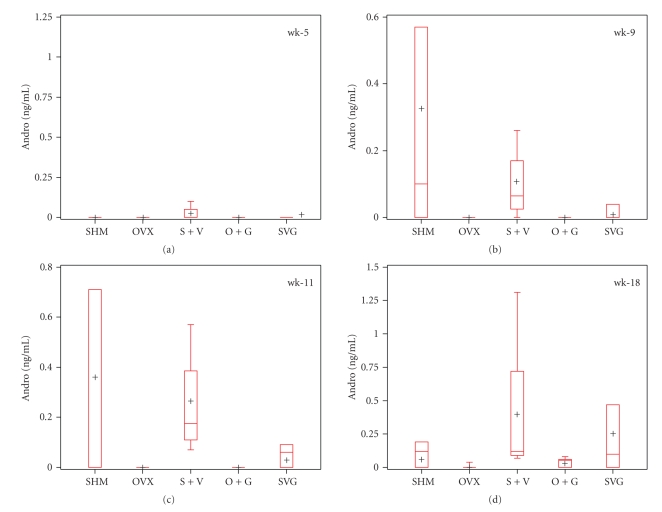
Figure 7.
Treatment effects on plasma androgen (ANDRO) concentrations of mice. The panel of boxplots illustrates the group medians (line within the box), means (+), interquartile range (length of the box), and the minimum and maximum values (extended whiskers) at each time point assessed. Data represent n = 3–6 samples/group. The Kruskal-Wallis test revealed the following P-values: wk-5, P = .3732; wk-9, P = .0387; wk-11, P = .0142; wk-18, P = .0593.

