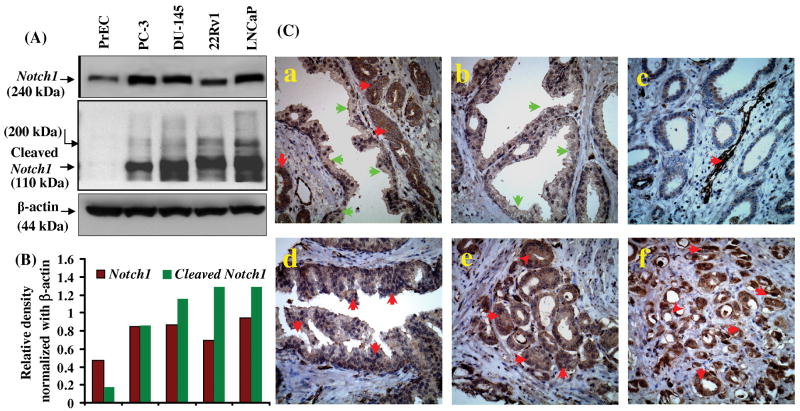
Figure 1. Expression of Notch1 in normal and prostate cancer cells and in prostate tumor tissue.
(A) Whole cell lysates were prepared and western blot analysis was performed to evaluate the protein levels of Notch1 and cleaved Notch1 in normal PrEC and PCa cell lines PC3, DU-145, LNCaP and 22Rν1. Blots were reprobed with β-actin antibody to analyze the equal loading of proteins. (B) Histogram represents density of bands in A normalized with β actin (C) Representative photomicrographs of prostate tumor biopsy specimen showing immunostaining for Notch1 in (a) cancerous as well as in normal adjacent tissue (b) normal prostate tissue (c) blood vessels in cancerous tissue (d) HGPIN (e) Gleason pattern 3 and (f) Gleason pattern 4. Green arrows indicate normal tissue with none to low staining and red arrows indicate cancerous tissue with moderate to high Notch1 expression.

