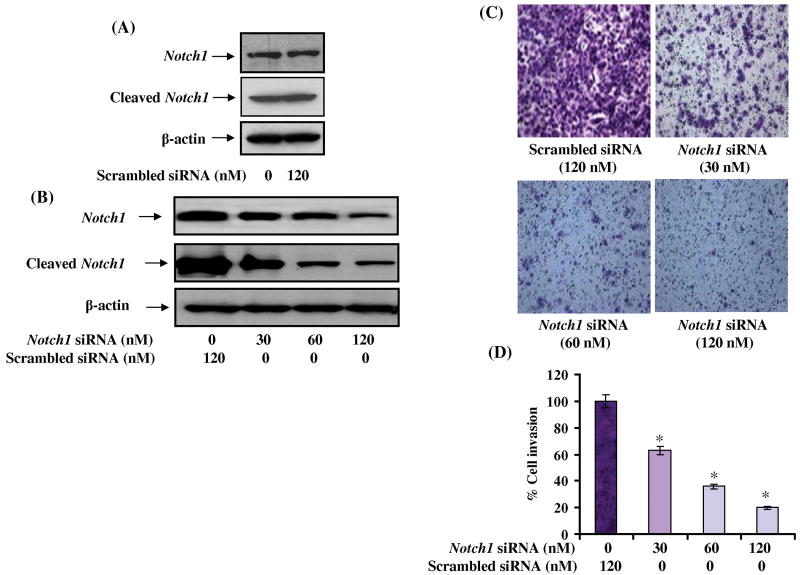
Figure 2. Effect of Notch1 knockdown on invasive behavior of PC3 cells.
(A) Notch1 expression in control and scrambled siRNA transfected cells. (B) Effect of Notch1 siRNA on the expression of Notch1 and cleaved Notch1. (C) Notch1 expression was knocked down in PC3 cells using Notch1 specific siRNA and subjected to invasion assay employing two-chambered invasion apparatus as described under materials and methods. The photomicrograph shows the number of migratory cells transfected with varying concentrations of Notch1 specific siRNA. (D) Histogram showing percent inhibition of PC3 cell invasion. The experiment was performed in triplicate and the value obtained from scrambled siRNA transfected cells was set as 100%.

