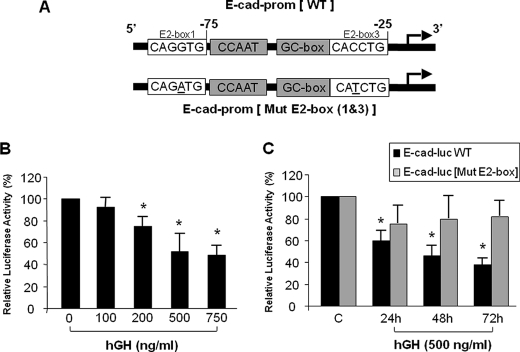
FIGURE 5.
GH-dependent decrease in E-cadherin promoter activity is mediated via ZEB2 binding sites on E-cadherin promoter. A, spatial organization of conserved E2 boxes (putative ZEB2 binding sites) on the E-cadherin promoter (E-cad-prom) (top schematic). The bottom schematic depicts the point mutations (underlined) introduced in the two E-boxes (Mut E2-box) designed to abrogate binding of ZEB2 to the E2 box ZEB2 binding sites on the E-cadherin promoter. B, HepG2 cells were transiently transfected with E-cadherin promoter-luciferase construct and then exposed to the indicated concentration of hGH for 24 h as detailed under “Experimental Procedures.” Cotransfection of Renilla luciferase was used to normalize transfection efficiency. The normalized luciferase activity of the cell exposed to GH is depicted relative to activity of the cells exposed to vehicle alone designated as 100%. Error bars indicate mean ± S.E.; n = 4. *, p < 0.05 compared with vehicle-treated cells. C, HepG2 cells were transiently transfected with either E-cadherin promoter-luciferase (E-cad-luc) (black bar) or E-cadherin promoter-luciferase construct with point mutations in the two E2 boxes (gray bar) and exposed to hGH (500 ng/ml) for the indicated time periods as detailed under “Experimental Procedures.” Cotransfection of Renilla luciferase was used to normalize transfection efficiency. The normalized luciferase activity for each individual construct exposed to GH is depicted relative to activity of the respective construct exposed to vehicle alone designated as 100%. Error bars indicate mean ± S.E.; n = 5–7. *, p < 0.01 compared with vehicle-treated cells.

