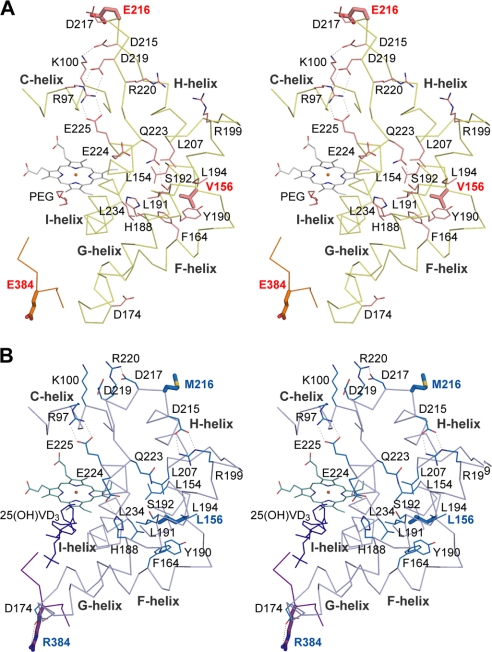
FIGURE 4.
Stereo view Cα trace of the Vdh-WT (panel A) and Vdh-K1 (panel B) in the region composing C-, FG-, and HI-helices and the C-terminal loop. Mutational residues at positions 156, 216, and 384 are depicted in sticks. Salt bridges and hydrogen bonds broken and reconstituted during open/close motion are shown as dashed lines. Side chains involving these hydrophilic interactions or hydrophobic residues nearby Leu156/Val156 creating hydrophobic core are in thin sticks and labeled.

