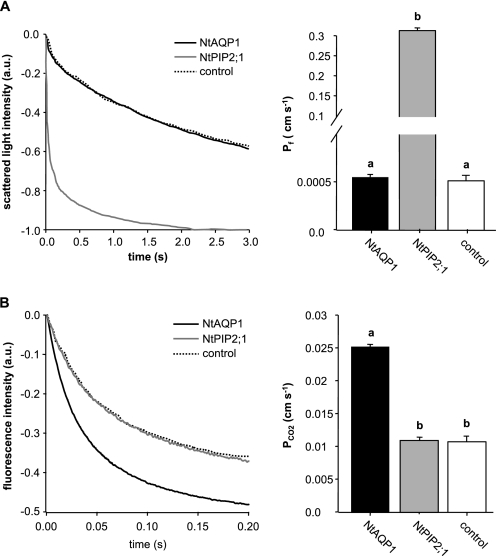
FIGURE 1.
Effect of NtAQP1 or NtPIP2;1 expression on CO2-triggered intracellular acidification or water permeability of yeast plasma membranes. A, water permeability. Left panel, representative time course of scattered light intensity in response to hypo-osmotic conditions. Yeast cells expressed NtAQP1, NtPIP2;1, or a control membrane protein (control) as indicated. Right panel, water permeability coefficient Pf (means ± S.E., n ≥ 100). p values for allocation to different significance groups indicated by different letters were <0.005 as determined by a two-tailed Student's t test. B, CO2-triggered intracellular acidification of yeast. Left panel, time course of intracellular acidification in response to CO2. Yeast cells expressed NtAQP1, NtPIP2;1, or a control membrane protein (control) in addition to tobacco carbonic anhydrase as indicated. Right panel, CO2 permeability coefficient PCO2 (means ± S.E., n ≥ 200). p values for allocation to different significance groups indicated by different letters were <0.005 as determined by a two-tailed Student's t test. a.u., arbitrary units.

