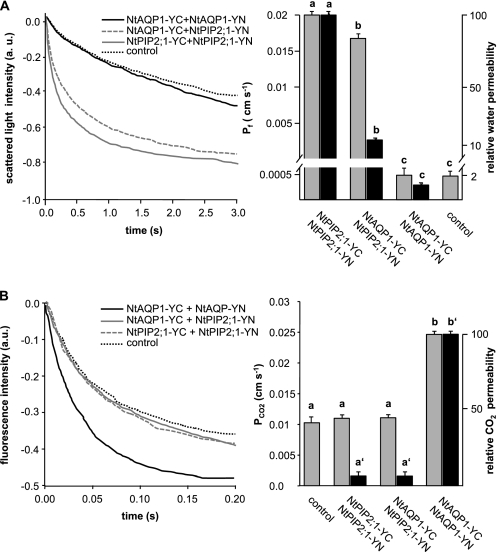
FIGURE 3.
Effect of BiFC-YFP aquaporin fusion proteins on CO2-induced intracellular acidification and water permeability of yeast plasma membranes. A, left panel, water uptake kinetics of yeasts expressing different BiFC-aquaporin fusion proteins as indicated. Right panel, calculated water permeability from raw data (gray columns) and water conductivity relative to the protein membrane fluorescence (black columns). The control bar depicts calculated water permeability. Relative water conductivity was not given as controls do not show aquaporin-related YFP fluorescence. Means ± S.E., n = 1500 (NtAQP1-YC+NtAQP1-YN), 1500 (NtAQP1-YC+NtPIP2;1-YN), 1300 (NtPIP2;1-YC+NtPIP2;1-YN), and 1000 (control). p values for allocation to different significance groups indicated by different letters were <0.005 as determined by a two-tailed Student's t test B, CO2-induced intracellular acidification of yeast cells expressing aquaporin constructs as indicated. Left panel, CO2-induced intracellular acidification rates. Calculated PCO2 data (gray columns) and values relative to the protein membrane fluorescence (black columns) are shown. The control bar depicts calculated water permeability. Relative CO2 conductivity was not given as controls do not show aquaporin-related YFP fluorescence. Means ± S.E.; n = 900 (NtAQP1-YC+NtAQP1-YN), 800 (NtAQP1-YC+NtPIP2;1-YN), 800 (NtPIP2;1-YC+NtPIP2;1-YN), and 800 (control). p values for allocation to different significance groups indicated by different letters were <0.005 as determined by a two-tailed Student's t test. a.u., arbitrary units.

