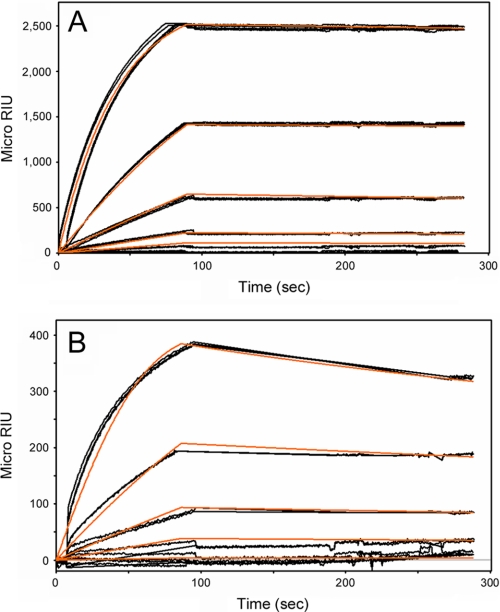
FIGURE 2.
Binding of CTA1 to Hsp90 or GRP94. A, Hsp90 was perfused over a CTA1-coated SPR sensor slide at 100, 400, 800, 1,600, and 3,200 nm concentrations. The ligand was removed from the perfusion buffer after 115 s. B, GRP94 was perfused over a CTA1-coated SPR sensor slide at 100, 200, 400, 800, and 1,600 nm concentrations. The ligand was removed from the perfusion buffer after 118 s. Note that the results for Hsp90 and GRP94 are plotted on different scales. For all conditions, ATP was present in the 37 °C perfusion buffer. Measurements collected from three independent experiments are shown. The orange lines represent best fit curves derived from the raw data using 1:2 (CTA1:Hsp90 or CTA1:GRP94) binding models. The SPR traces display, from top to bottom of the graph, results for decreasing concentrations of the ligand.

