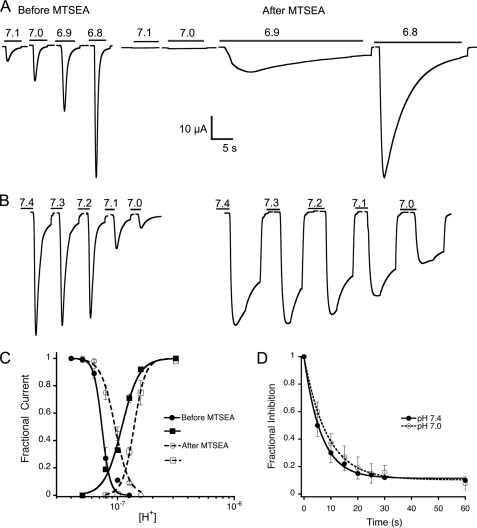
FIGURE 7.
State-dependent accessibility of extracellular MTSEA in xASIC1.1-N415C. A, currents evoked by increasing concentrations of protons from a cell before and after a 30-s application of 2.5 mm MTSEA at pH 7.4 (closed channel). Between activations, the external pH was returned to 7.6 for 10 s to recover from desensitization. Traces before and after are shown in the same time scale. B, currents evoked by pH 6.9 after a 10-s perfusion with preconditioning solutions of the indicated pH before and after 2.5 MTSEA applied at pH 7.0 (desensitized) for 30 s. Traces correspond to the same cell. C, dose-response curves of protons generated before and after modification of xASIC1.1-N415C by MTSEA. D, time course of 2.5 mm MTSEA reaction measured as the change in peak current evoked by pH 7.0 in xASIC1.1-N415C (RpH7.4 = 63 and RpH7.0 = 46 m−1 s−1).

